Earth Science
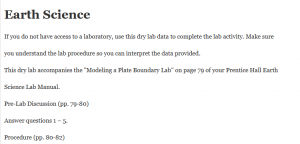
If you do not have access to a laboratory, use this dry lab data to complete the lab activity. Make sure
you understand the lab procedure so you can interpret the data provided.
This dry lab accompanies the “Modeling a Plate Boundary Lab” on page 79 of your Prentice Hall Earth
Science Lab Manual.
Pre-Lab Discussion (pp. 79-80)
Answer questions 1 – 5.
Procedure (pp. 80-82)
1. Look at the map on Resource 3 in the DataBank. Examine the convergence of the Pacific tectonic
plate and the North American tectonic plate, south of the Aleutian Arc of volcanic islands in the
northern Pacific Ocean.
2. Look at the diagram on page 80 to help you understand how the edges of the Pacific plate and the
North American plate converge.
3. Look at the Data Table on page 81. This Data Table shows the Depths of Foci and Latitudes of
earthquakes occurring in the Aleutian Islands. These earthquakes all occurred near the 180° W
longitude. Examine the table. Do you see any patterns in the data?
Analysis and Conclusions (pp. 82-84)
Figure 1
9/21/2020 Apex Learning – Dry Lab
https://course.apexlearning.com/public/cpop/2/1/4/1706855 2/5
Figure 1 shows a graph of location and depth of earthquakes, based upon the information in the
Data Table on page 81. The line is a line of best fit that comes as close as possible to each of the
data points. Use Figure 1 to answer the following questions.
1. Using Graphs
What is the relationship between the depths of earthquake foci and latitude?
2. Analyzing Data
How does the graph show that the boundary between the Pacific plate and the North American
plate is a convergent boundary?
3. Applying Concepts
The Aleutian trench is located where the two tectonic plates meet at the surface of the
lithosphere. Use the graph above to determine the approximate latitude of the Aleutian trench at
180° W longitude. Explain your answer.
9/21/2020 Apex Learning – Dry Lab
https://course.apexlearning.com/public/cpop/2/1/4/1706855 3/5
4. Using Graphs
Calculate the slope of the graph to figure out how quickly the convergent boundary descends as
latitude increases.
5. Calculating
A change in latitude of 1 degree corresponds to an approximate 111 km distance along a north-
south line. Use this information along with your answer to question 4 to determine how far the
convergent boundary descends as it moves 1 km northward. Show all calculations.
6. Using Models
The triangle below shows a side view of the convergent boundary with the correct scale
relationship between the depth and the horizontal distance. The angle at which the subducted
plate descends beneath the upper plate is 52° and is known as the subduction angle.
9/21/2020 Apex Learning – Dry Lab
https://course.apexlearning.com/public/cpop/2/1/4/1706855 4/5
7. Calculating
Imagine there is a volcanic island arc on the surface of the lithosphere above the area where the
descending plate has a depth of 100 km. Approximately how far north of this trench are the
islands located? Show all calculations.
8. Evaluating and Revising
Are all of the data points plotted on the graph close to the line of best fit? Provide explanations for
why they are or are not.
9/21/2020 Apex Learning – Dry Lab
https://course.apexlearning.com/public/cpop/2/1/4/1706855 5/5
9. Applying Concepts
Is the year in which an earthquake occurred an important variable in this investigation? Why or
why not?