Descriptive Statistics And Cumulative_frequency
descriptive statistics [219 marks]
1a.
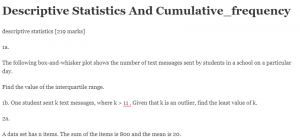
The following box-and-whisker plot shows the number of text messages sent by students in a school on a particular day.
Find the value of the interquartile range.
1b. One student sent k text messages, where k > 11 . Given that k is an outlier, find the least value of k.
2a.
A data set has n items. The sum of the items is 800 and the mean is 20.
Find n.
2b.
The standard deviation of this data set is 3. Each value in the set is multiplied by 10.
Write down the value of the new mean.
2c. Find the value of the new variance.
[2 marks]
[4 marks]
[2 marks]
[1 mark]
[3 marks]
3a.
A city hired 160 employees to work at a festival. The following cumulative frequency curve shows the number of hours employees worked during the festival.
Find the median number of hours worked by the employees.
3b. Write down the number of employees who worked 50 hours or less.
3c.
The city paid each of the employees £8 per hour for the first 40 hours worked, and £10 per hour for each hour they worked after the first 40 hours.
Find the amount of money an employee earned for working 40 hours;
3d. Find the amount of money an employee earned for working 43 hours.
3e. Find the number of employees who earned £200 or less.
3f. Only 10 employees earned more than £ . Find the value of .k k
[2 marks]
[1 mark]
[1 mark]
[3 marks]
[3 marks]
[4 marks]
4a.
Consider the following frequency table.
Write down the mode.
4b. Find the value of the range.
4c. Find the mean.
4d. Find the variance.
5a.
Ten students were surveyed about the number of hours, , they spent browsing the Internet during week 1 of the school year. The results of the survey are given below.
Find the mean number of hours spent browsing the Internet.
x
10∑ i=1 xi = 252, σ = 5 and median = 27.
5b. During week 2, the students worked on a major project and they each spent an additional five hours browsing the Internet. For week 2, write down
(i) the mean;
(ii) the standard deviation.
5c. During week 3 each student spent 5% less time browsing the Internet than during week 1. For week 3, find
(i) the median;
(ii) the variance.
[1 mark]
[2 marks]
[2 marks]
[2 marks]
[2 marks]
[2 marks]
[6 marks]
5d.
During week 4, the survey was extended to all 200 students in the school. The results are shown in the cumulative frequency graph:
(i) Find the number of students who spent between 25 and 30 hours browsing the Internet.
(ii) Given that 10% of the students spent more than k hours browsing the Internet, find the maximum value of .k
6a.
A school collects cans for recycling to raise money. Sam’s class has 20 students.
The number of cans collected by each student in Sam’s class is shown in the following stem and leaf diagram.
Find the median number of cans collected.
6b.
The following box-and-whisker plot also displays the number of cans collected by students in Sam’s class.
(i) Write down the value of .
(ii) The interquartile range is 14. Find the value of .
a
b
[6 marks]
[2 marks]
[3 marks]
6c. Sam’s class collected 745 cans. They want an average of 40 cans per student.
How many more cans need to be collected to achieve this target?
6d.
There are 80 students in the school.
The students raise $0.10 for each recycled can.
(i) Find the largest amount raised by a student in Sam’s class.
(ii) The following cumulative frequency curve shows the amounts in dollars raised by all the students in the school. Find the percentage of students in the school who raised more money than anyone in Sam’s class.
[3 marks]
[5 marks]
6e.
The mean number of cans collected is 39.4. The standard deviation is 18.5.
Each student then collects 2 more cans.
(i) Write down the new mean.
(ii) Write down the new standard deviation.
7a.
There are 10 items in a data set. The sum of the items is 60.
Find the mean.
7b.
The variance of this data set is 3. Each value in the set is multiplied by 4.
(i) Write down the value of the new mean.
(ii) Find the value of the new variance.
8a.
Let .
For the graph of f:
(i) write down the -intercept;
(ii) find the -intercept;
(iii) write down the equation of the horizontal asymptote.
f(x) = e0.5x − 2
y
x
[2 marks]
[2 marks]
[3 marks]
[4 marks]
8b. On the following grid, sketch the graph of , for .
f
−4 ⩽ x ⩽ 4
9a.
The following box-and-whisker plot represents the examination scores of a group of students.
Write down the median score.
The range of the scores is 47 marks, and the interquartile range is 22 marks.
9b. Find the value of
(i) ;
(ii) .
c
d
[3 marks]
[1 mark]
[4 marks]
10a.
The following cumulative frequency graph shows the monthly income, dollars, of families.
Find the median monthly income.
I 2000
10b. (i) Write down the number of families who have a monthly income of dollars or less.
(ii) Find the number of families who have a monthly income of more than dollars.
2000
4000
10c. The families live in two different types of housing. The following table gives information about the number of families living in each type of housing and their monthly income .
Find the value of .
2000 I
p
10d. A family is chosen at random.
(i) Find the probability that this family lives in an apartment.
(ii) Find the probability that this family lives in an apartment, given that its monthly income is greater than dollars.4000
10e. Estimate the mean monthly income for families living in a villa.
[2 marks]
[4 marks]
[2 marks]
[2 marks]
[2 marks]
11a.
The weights in grams of 80 rats are shown in the following cumulative frequency diagram.
Do NOT write solutions on this page.
Write down the median weight of the rats.
11b. Find the percentage of rats that weigh 70 grams or less.
11c. The same data is presented in the following table.
Weights grams
Frequency
Write down the value of .
w
0 ⩽ w ⩽ 30 30 < w ⩽ 60 60 < w ⩽ 90 90 < w ⩽ 120 p
45 q
5
p
[1 mark]
[3 marks]
[2 marks]
11d. The same data is presented in the following table.
Weights grams
Frequency
Find the value of .
w
0 ⩽ w ⩽ 30 30 < w ⩽ 60 60 < w ⩽ 90 90 < w ⩽ 120 p
45 q
5
q
11e. The same data is presented in the following table.
Weights grams
Frequency
Use the values from the table to estimate the mean and standard deviation of the weights.
w
0 ⩽ w ⩽ 30 30 < w ⩽ 60 60 < w ⩽ 90 90 < w ⩽ 120 p
45 q
5
11f. Assume that the weights of these rats are normally distributed with the mean and standard deviation estimated in part (c).
Find the percentage of rats that weigh 70 grams or less.
11g. Assume that the weights of these rats are normally distributed with the mean and standard deviation estimated in part (c).
A sample of five rats is chosen at random. Find the probability that at most three rats weigh 70 grams or less.
12a.
Consider the following cumulative frequency table.
Find the value of .p
12b. Find
(i) the mean;
(ii) the variance.
13. A random variable is normally distributed with
and .
Find the interquartile range of .
X
μ = 150 σ = 10
X
[2 marks]
[3 marks]
[2 marks]
[3 marks]
[2 marks]
[4 marks]
[7 marks]
14a.
The weekly wages (in dollars) of 80 employees are displayed in the cumulative frequency curve below.
(i) Write down the median weekly wage.
(ii) Find the interquartile range of the weekly wages.
14b. The box-and-whisker plot below displays the weekly wages of the employees.
Write down the value of
(i) ;
(ii) ;
(iii) .
a
b
c
14c. Employees are paid per hour.
Find the median number of hours worked per week.
$ 20
[4 marks]
[3 marks]
[3 marks]
14d. Employees are paid per hour.
Find the number of employees who work more than hours per week.
$20
25
15a.
The cumulative frequency curve below represents the marks obtained by 100 students.
Find the median mark.
15b. Find the interquartile range.
[5 marks]
[2 marks]
[3 marks]
16a.
The histogram below shows the time T seconds taken by 93 children to solve a puzzle.
The following is the frequency distribution for T .
(i) Write down the value of p and of q .
(ii) Write down the median class.
16b. A child is selected at random. Find the probability that the child takes less than 95 seconds to solve the puzzle.
16c. Consider the class interval .
(i) Write down the interval width.
(ii) Write down the mid-interval value.
45 ≤ T < 55
16d. Hence find an estimate for the
(i) mean;
(ii) standard deviation.
16e. John assumes that T is normally distributed and uses this to estimate the probability that a child takes less than 95 seconds to solve the puzzle.
Find John’s estimate.
[3 marks]
[2 marks]
[2 marks]
[4 marks]
[2 marks]
17a.
A scientist has 100 female fish and 100 male fish. She measures their lengths to the nearest cm. These are shown in the following box and whisker diagrams.
Find the range of the lengths of all 200 fish.
17b. Four cumulative frequency graphs are shown below.
Which graph is the best representation of the lengths of the female fish?
18a.
A standard die is rolled 36 times. The results are shown in the following table.
Write down the standard deviation.
18b. Write down the median score.
18c. Find the interquartile range.
19a.
The following frequency distribution of marks has mean 4.5.
Find the value of x.
19b. Write down the standard deviation.
[3 marks]
[2 marks]
[2 marks]
[1 mark]
[3 marks]
[4 marks]
[2 marks]
20a.
The following table gives the examination grades for 120 students.
Find the value of
(i) p ;
(ii) q .
20b. Find the mean grade.
20c. Write down the standard deviation.
21a.
A fisherman catches 200 fish to sell. He measures the lengths, l cm of these fish, and the results are shown in the frequency table below.
Calculate an estimate for the standard deviation of the lengths of the fish.
[4 marks]
[2 marks]
[1 mark]
[3 marks]
21b. A cumulative frequency diagram is given below for the lengths of the fish.
Use the graph to answer the following.
(i) Estimate the interquartile range.
(ii) Given that of the fish have a length more than , find the value of k.
40% k cm
21c. In order to sell the fish, the fisherman classifies them as small, medium or large.
Small fish have a length less than .
Medium fish have a length greater than or equal to but less than .
Large fish have a length greater than or equal to .
Write down the probability that a fish is small.
20 cm
20 cm 60 cm
60 cm
21d. The cost of a small fish is , a medium fish , and a large fish .
Copy and complete the following table, which gives a probability distribution for the cost .
$4 $10 $12
$X
21e. Find .E(X)
[6 marks]
[2 marks]
[2 marks]
[2 marks]
22a.
The following diagram is a box and whisker plot for a set of data.
The interquartile range is 20 and the range is 40.
Write down the median value.
22b. Find the value of
(i) ;
(ii) .
a
b
23a.
The following is a cumulative frequency diagram for the time t, in minutes, taken by 80 students to complete a task.
Write down the median.
23b. Find the interquartile range.
23c. Complete the frequency table below.
[1 mark]
[4 marks]
[1 mark]
[3 marks]
[2 marks]
Printed for American Creativity Academy
© International Baccalaureate Organization 2019
International Baccalaureate® – Baccalauréat International® – Bachillerato Internacional®
24a.
A box contains 100 cards. Each card has a number between one and six written on it. The following table shows the frequencies for each number.
Calculate the value of k.
24b. Find
(i) the median;
(ii) the interquartile range.
25a.
In a school with 125 girls, each student is tested to see how many sit-up exercises (sit-ups) she can do in one minute. The results are given in the table below.
(i) Write down the value of p.
(ii) Find the value of q.
25b. Find the median number of sit-ups.
25c. Find the mean number of sit-ups.
[2 marks]
[5 marks]
[3 marks]
[2 marks]
[2 marks]
- descriptive statistics [219 marks]